
Global hop market
- The world Beer Market 3.0 and its demand for hop
- The world hop production
- The world hop trade
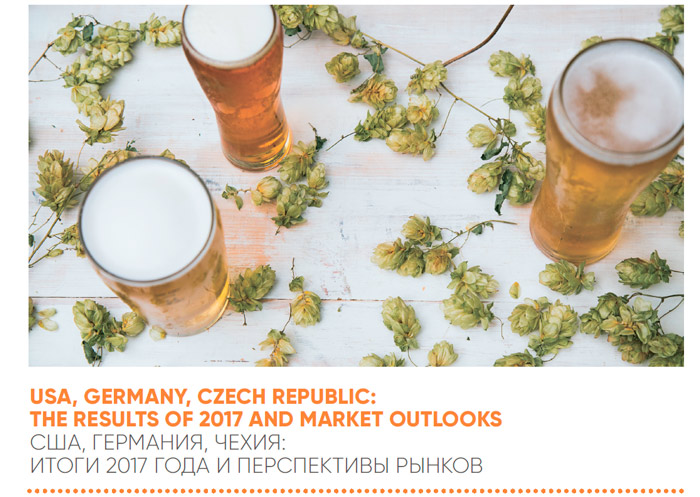
- USA, Germany, Czech Republic – the results of 2017 and market outlooks:
- The USA – it is probably enough
- Germany – plans vs weather
- Czech Republic – classic monohop
Hop Market in Russia
- What and how affected the domestic market
- Pattern of imports of hop pellets
- Alpha and Aroma
- Hop extracts
- Own production: not much so far
- The volume of alpha acid
A local alternative to mass beer suggested by independent brewers has been successful and is now altering the global market. Beer is becoming more diversified, so transnational companies have to accept the new game rules and to switch focus to young and fast growing markets. All these processes increased the demand for aroma and bitter hop as well as their acreage expansion on two continents. However now there appeared a downward trend of alcohol consumption in the world, so even special sorts can soon turn to be sufficient. In this connection the dynamic American hop market is already facing some problems. EU hop producers have become more cautious, they are not racing to exceed the demand and look forward with more confidence, judging by the contract terms.
The world Beer Market 3.0 and its demand for hop
The beer consumption in the major markets (the USA, EU, Сhina, Russia, and Japan) has already passed the point of saturation and so far there is no significant rise in view. Transnational companies made up for the lost volumes by M&A and expanding to developing markets. Yet, the monopolization “backfired” by the beer taste standardization and simplification especially in the developing markets. Ever less of traditional and expensive components namely, malt and hop has been used by big companies, which also relies on cost effective technologies.
One can even point out the watershed moment, that is 2007, when poor crop lifted the world prices for both malt barley and hop. They reached a local peak in 2008 for hop. The pressing need for raw materials made brewers optimize the intake via different ways, and transnational companies have most succeeded in it. But though growers rapidly eliminated the deficit, and the prices decreased, the intake of barley malt and hop went down and never regained the previous level. Instead, purchases of unmalted grains and maltose syrup have risen. However, increasing popularity of light beer in the USA and Europe has also made an impact.
Typically, exactly in this period the process of the world market consolidation stopped. The USA saw the beginning of the craft brewing boom, Eastern Europe medium regional breweries offered the original concept of “live beer” as an alternative to eurolagers. Technically, in regards to quality mass brands remained implacable, but consumers just happened to prefer local brands by independent breweries. This evolution of beer lovers’ preference and the stage, continuing till roughly 2016, can be called Beer Market 2.0.
Local brewers have bigger specific consumption of malt and hop in beer production. That is why though regional brewers are much behind transnational companies in the market share, their growth drew stabilization in the hop market. Following the rise in demand, there appeared at first a light and then ever more dynamic increase in hop supply, which resulted from acreage expanding as well as from new sorts developing.
However, due to the changing consumer behavior, especially among the younger generation, sale uplift of alternative sorts was also restricted (let us call this new reality Beer Market 3.0), though it seemed unstoppable only a couple of years ago.
In the USA the rates of craft beer sales became single digit, besides, beer lovers increasingly defy the stereotype of craft being a high-hopped beer. In Eastern Europe regional brewers having taken everything they could from transnational companies themselves started facing stagnation or even reduction of their beer sales. Asian markets are rapidly developing, but the taste demands to beer of most of consumers still remain very modest.
Instead, the shrinking market share of transnational companies has brought them to the same field with local players. Such mimicry induces higher rate of use of malt and hop. Besides, the volume of the raw material intake grows due to the market share increase of premium brands and launching of new marginal sorts with higher gravity and more hop. This trend can be traced at the biggest markets of Eastern Europe and Asia.
Let us make the first conclusions. In the nearest future the demand for hop will depend on:
1) the prospects of craft trend in the USA and beyond them (in the nearest future the segment expansion can take place due to the EU countries);
2) branding and technological policy of transnational companies – whether they will be more actively fighting for consumers’ loyalty by making their beer taste more complex.
3) the speed of premiumization of developing markets, of Asia in the first place, which will mostly depend on the growth of economies and the middle class share in the FMCG consumption.

The world hop production
The two world centers of hop production are located in the EU and USA. Main hop growing areas can be localized on compact territories. For example, Hallertau valley in Germany, and town Žatec in the Czech republic are located 300 km from each other. In these two areas nearly 3/4 of the European hop is grown. In the same way in the USA nearly 3/4 of the total crop volume is grown in Yakima valley (adjacencies of the same name river and town). At one time, China was trying to become a third center of hop-growing, however now, it is much behind Europe and the USA by volumes, the Chinese share in the world production if hop is not big.
For a good hop crop summer has to be humid enough. So the demands to conditions of hop growing make the situation on the global hop market rather dependent on the weather conditions and other risks (the fire in the USA in 2006 for example). Besides, one can speak of specialization by hop types and sorts both at different companies and in general by the geography of planting.
About one-half of the European hop cultivation area is accounted by bitter hop sorts and the rest is under aroma sorts. As for the American hop-growers, who sell nearly a half of their volume to craft brewers, there the aroma share is much bigger, about 80% of the total acreage.
The hop production is characterized by not only weather dependence but also by inertance. It results from hop being a perennating plant that gives a full value yield only in the third year and demands significant investments for new planting areas and maintaining operating areas. So we can judge on the way hop growers see their business medium-term prospects by the changes in cultivation areas.
Optimistic view has prevailed so far. Judging by International Hop Growers’ Convention (IHGC) data in 2017 the global hop production experienced a rapid acreage expansion. The growth trend started in 2013 having followed a four-year period of decline. These fluctuations were caused by the brewers’ demand changes we have discussed above.
Hop acreage expanded in 2017 by 5.7% to 57 839 ha, which means retaining the high growth rates. Compared to the “bottom” of 2013 when the global cycle of hop acreage recovering began, it grew by 26.7%. We also have to point out that the world acreage almost hit the record level of 2008.
Taking into account November data of IHGC consensus as well as the industry organization, the volume of the global hop production in the key 19 countries will go 6% up and reach nearly 116 thousand tons. Quite possibly, this volume will remain a record figure for the foreseeable future. The alpha acid output will grow by 4% to 11 thousand tons.
The world hop trade
Thanks to high price and transportation easiness hop has long ago become a global commodity that is often sold far from the production location. The volume of yearly world trade has fluctuated since 2000 between 34 and 48 mln tons amounting to 20-28% of the global crop volume.
Here we should keep in mind that the major hop-growing regions are perfectly located as for its consumption geography. And since the biggest hop growing countries are simultaneously the biggest beer producers, the volume of the oversea trade is not so big. Besides, a part of hop is processed into extracts or sold outside the brewing industry. These commodity categories usually have special HS codes.
The global trade dynamics in general is usually in tune with fluctuations of hop products output, taking into account stocks formed by producers and consumers. After a poor harvest, the prices grow and the trade volumes go down, so brewers turn to their feedstock or reduce their hop consumption. That happened for example in 2003-2006 and 2010-2013. And on the contrary, the hop trade reached its peak in 2008 and 2016.
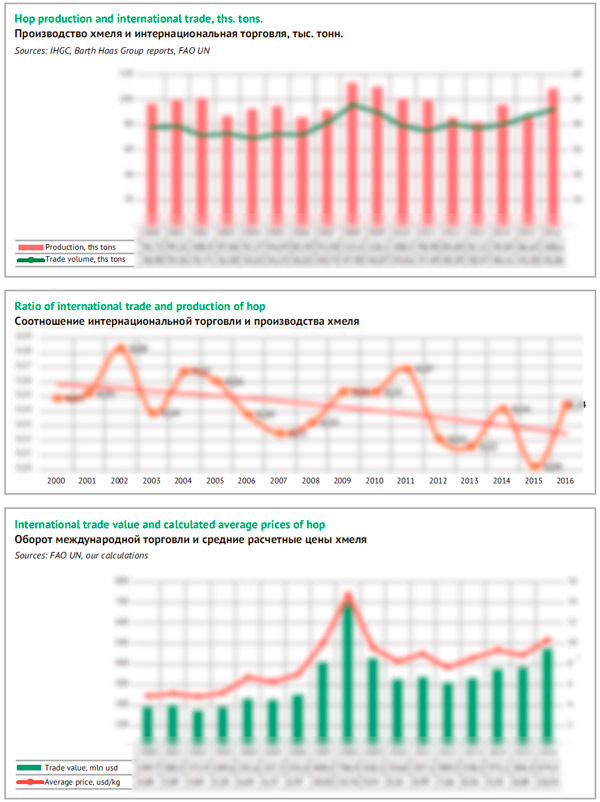
Over the recent years, the supply volumes have been growing due to the increase of the hop production volume. In 2016, the volume of the world trade grew by …% and reached … thousand tons. By value the growth amounted to …%, to $… mln.
Basing on the natural and monetary expressions, the average custom value of hop increased by …%, having reached $… for a kilo. But here we should take into account that a significant part of hop is transported to affiliated subdivisions of companies or of the same company, which is quite often. Besides, supplies are often made according to futures contracts. So the custom value of a commodity unit cannot be an equivalent of its real and actual market price. However, the fluctuations of the value often reflect the market situation; we can see that in 2016 the demand for hop was rather high.
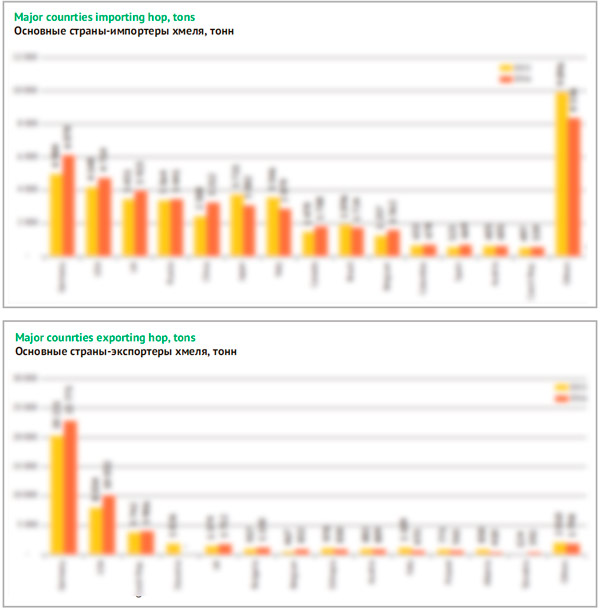
The structure of hop export by the leading companies is quite simple. The … of the hop supplies is delivered by Germany. Another … is accounted by the USA, nearly …% of hop is exported from the Czech republic, and less than 10% come from Great Britain and Slovenia. The rest of countries do no make any significant hop supplies and if they take it abroad, it is usually previously imported hop transported further for logistic or trade reasons.
It is much more difficult to define the key purchasers of hop. Among hop importers one cannot determine the obvious leaders, but it is possible to enumerate the countries that are constantly in the top ten. Despite the plentifulness of their own raw materials the USA and Germany are still the biggest purchasers of imported hop, which is caused by diversity of local beer tastes, high consumption volumes of hop as well as by the traditional German specification in bitter hop varieties, while aroma varieties are preferred in the USA. The same can be said about Great Britain.
Besides, the top ten of purchasers always includes the countries that do not have a developed hop production, while their volumes of brewing are rather large. In 2016, the fourth place among hop importers was taken by Russia. Besides, large amounts of hop are sold to Italy and two Asian leaders, China and Japan (quite probably Vietnam and India will also gain volumes over time).
The seven named countries are the purchasers of the biggest scale compared to a lot of many other markets and consume nearly … of all imported hop.
The USA: it is probably enough
Nearly ten years ago in the USA there started a craft boom, which was partially driven by high hopped beer sorts. Soon fundamental changes on the hop market, we will look in some detail, followed.
Fast growth of craft breweries number and their turnover increase were taking place at the same time with expanding of hop consumption rate. That provided the powerful synergic impulse for hop production.
According to surveys by The Brewers Association the rate of hop consumption at beer production has been constantly and gradually growing since 2009, both by craft beer manufacturing and by specific breweries. A considerable increase (in general by craft brewers from 0.95 to 1.12 lb per barrel) was observed in 2009, when the raw material deficit only started being liquidated. Enthusiastic brewers were still experiencing serious difficulties with hop while IPA were rapidly gaining popularity. Later, in 2015-2016, the hop intake per a volume unit was growing by 6% YOY.
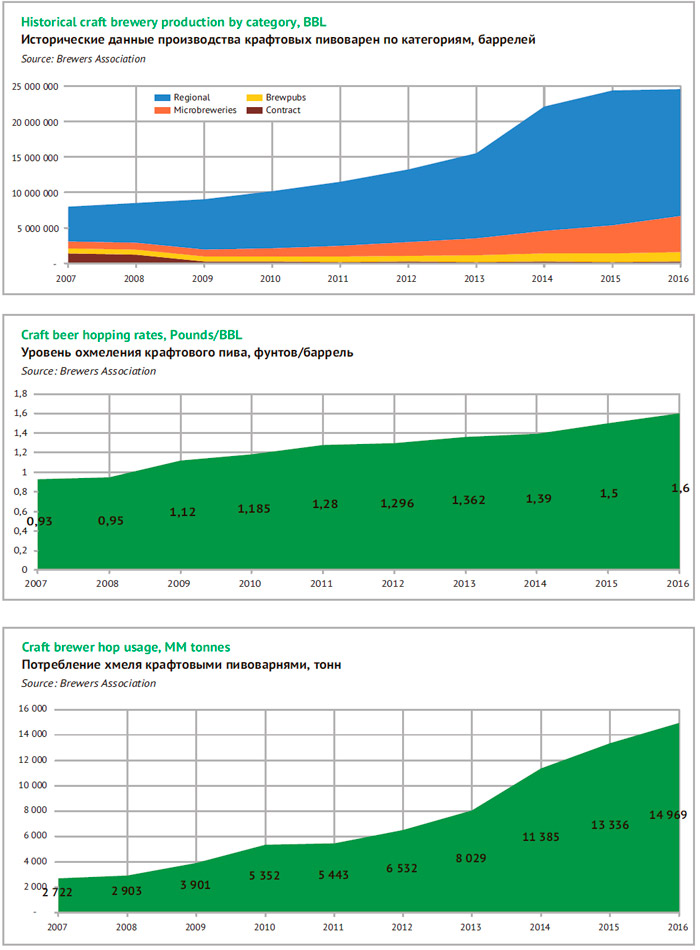
Hop producers rapidly reacted to the craft boom by expansion aroma hop acreage. But because of the overproduction crisis, the general hop acreage reduction of different varieties went on inertia till 2011. The demand recovering was not so obvious at first but soon transformed into a long term upward trend. In 2014, after a local jump of craft beer consumption, there started a new cycle of rapid acreage expansion. And from 2009 till 2017 the 80/20 proportion of alpha and aroma hop varieties has changed in inversed manner for aroma hop favor.
If we compare data by The Brewers Association to the dynamics of hop production, one can say that till 2014 in the USA it was growing only due to craft brewers, and later not only due to them. The hop intake by craft breweries over 2007-2016 grew five times and reached 33 mln lb (the increase by metric calculation equals 14 969 tons). Over that time, the share of craft brewers in hop purchases grew from 10 to 38%.
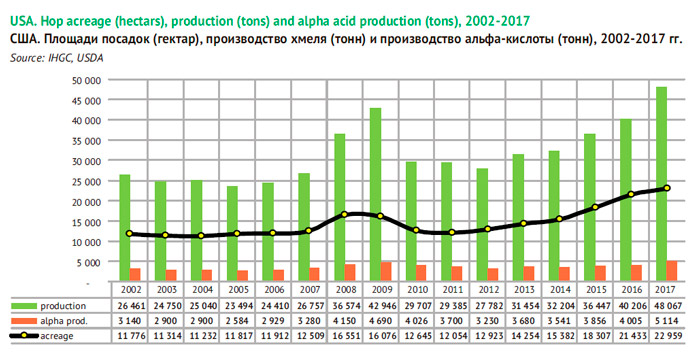
According to the November data by IHGC the year of 2017 was record-breakingly plentiful. The hop production grew by 20% to 48 067 tons and there was by 28% more alpha acid produced, that is, 5 114 tons. So in 2017, the USA again topped the list of countries producing hop and alpha acid having left Germany behind.

Yet it will be difficult if reasonable to hold their leadership. One could expect the demand for hop to grow, as long as the craft beer market demands more raw materials. But the previous two-digit rates of growth, registered by The Brewers Association have already become moderate or even changed for stagnation.
In November 2017, CNBC site published the forecast by The Brewers Association for craft beer sales in the USA. By the end of the year, one can expect a 5-6% increase of natural volumes, that is, at the level with 2016. The market share of craft brewers will grow a little and reach 12%. By IRI Worldwide estimation the craft beer sales volume for January-November has risen by 3.6%.
However, the figures depend on the basis and method, that is, on who is considered to be a craft brewer and how it is calculated. For example, “historical data” on the website of The Brewers Association with craft beer production divisions by segments demonstrate that by the end of 2016 the growth was not 6% but 1%. And the data describe the double speed character of the craft beer production depending on the business size.
The sharp increase of volumes over 2009-2014 was mainly caused by large craft breweries of regional and national level. However, in 2015 they faced an equally abrupt output rate deceleration and in 2016 there was a decline for the first time in many years (-6%). In particular, four out of five biggest craft breweries reported a downturn in sale volumes (D.G. Yuengling & Sons, Boston Beer Company, Sierra Nevada, and Gambrinus Company).
The year of 2017 is not likely to be positive for the segment leaders either. There is not enough public info so far, but for example Boston Beer Company has already announced that the sale volumes went 6% down over the first three quarters of 2017. It is known that by dollar the sales of Sierra Nevada and a number of other companies decreased.
One of the major reasons for what is happening is quite obvious as the microbreweries focused on their own city or small territory are still enjoying sale growth. In 2016, their output volumes increased by 26% and are likely to show a two digit growth percentage in 2017 too. Many commenters and experts of the USA market make a conclusion that unlike the local brands by microbreweries, brands with wide distribution are gradually losing their craft image among sophisticated beer lovers.
Fiercer though not direct competition between craft brewers of different scale is a sign of a mature market which is not likely to grow rapidly. Yet the hop acreage expanded basing on the optimistic forecast of the two digit growth. According to USDA in 2017, there was further increase of hop acreage and production in all the tree major states, namely Washington, Oregon, and Ohio. In sum they expanded by 6.4% to 54 135 acres or to 21 908 hectares. Approximately the same data are cited by IHGC all over the country, that is, a 7.1% growth to 22 959 ha. The rates are a little bit slower than in 2016, but still very high.
Now, due to the long cycle and inertia in the hop production, the market players speak of its possible oversupply in the nearest years. For the first time the risk of overproduction was mentioned by Ann George, executive producer at Hop Growers of America in summer 2016. She urged the market players to be cautious in contracting to keep a balance in the hop market.
Thus according to USDA data, hop stocks (including processing into extracts and pellets) by September 2017 have increased by 15.3% to 98 mln lb. At the same time brewers were reducing their hop stocks at warehouses (from 38 to 36 mln lb). That is, the current stocks were increasing due to dealers’ and hop producers’ activity.
Some brewers due to the sale decline went on using their current hop stocks. Others have long ago lost optimism as for their future growth. And some brewers are sure they will have enough hop in 2018 or buy it at the spot market.
Those in the biggest trouble now are the brewers who remembering the hop deficit of 2010-2011 fell for the euphoria of the craft market rapid growth and made long-term contracts that seem impossible now.
But this is only a part of problem for hop producers and traders. Unlike ten years ago, currently the bulk of hop sales is accounted by aroma varieties with comparatively short shelf life. The altering preferences of craft beer lovers create additional difficulties. Some hop varieties have become unfashionable or formed an excess so the prices at the spot market have gone much lower than the contracted ones. Brewers are tempted to refuse contracts at least for the varieties they do not need anymore.
Contracted hop share in USA as % of crop in year N
| Contract | Year N | Year N+1 | Year N+2 | Year N+3 | Year N+4 | Year N+5 |
| 2017 | 98% | 95% | 65% | 40% | 30% | 25% |
| 2016 | 98% | 98% | 98% | 80% | 80% | 50% |
| 2015 | 100% | 100% | 100% | 80% | 80% | 50% |
| 2014 | 98% | 88% | 85% | 45% | 35% | 35% |
| 2013 | 100% | 80% | 60% | 40% | ||
| 2012 | 90% | 75% | 50% | 20% |
Source: International Hop Growers’ Convention
Official data also speak for the higher risks for hop producers, as dramatic shortening of the contract terms was registered by IHGC in 2017. While in 2016, almost 100% of the crop was sold for the third year ahead, in 2017 taking into account the previous obligations, the share of such contracts decreased to 65%.
Small trading companies started experiencing financial difficulties. For example, in August 2017, company 47Hops that specialized in hop sales announced the start of bankrupt procedure and obligation restructuring. 47Hops tried to refocus a part of supplies to export, yet the problems in the domestic market turned out to be too serious.
Here we should in full cite Douglas MacKinnon 47Hops president who is explaining his decision to the partners:
«The growth in the craft beer market in the United States has slowed from 18% per year in 2014 to its current level of 5-6% growth per year. Unfortunately, during the past several years, brewers fuelled by optimism contracted for more hops than they now need due to that slower rate of growth. Based on our contracts with brewers, we, in turn, contracted with suppliers to cover our brewer contracts. Based on late brewer payments, it seems a good portion of those hops are simply not necessary in today’s market. 47Hops has attempted to renegotiate its contracts with several larger suppliers. Unfortunately, some of them were not willing or able to renegotiate their contracts with us to the extent necessary to match the declining needs of the market.
During the past year, a sizeable number of brewers with whom 47Hops has contracts have delayed payment for and delivery of their hops. Payments for some contracted hops are one year behind schedule. Some brewers have stopped responding to calls and emails altogether. We understand that is likely a result of reduced beer sales and cash flow problems in their businesses and not something they are doing with malicious intent. However, this has caused the accumulation of two things at 47Hops: 1) purchased aroma inventory in the warehouses, and 2) debt as a result of purchasing that inventory.
The slow or non-existent payment for contracted hops increases the cost, risk and burden of financing to an already risky business. As 47Hops is a family-owned business, this creates substantial disadvantages in our cost structure that revenue from once-profitable contracts simply cannot cover. The uncertainty as to the ability of our brewery customers to pay for and take delivery of future contracted inventory created an uncertain future that was very likely unsustainable without drastic action. We decided, therefore, to proactively deal with the problem rather than wait until the situation caused irreparable harm to the company and left us with no options»
However, the sales redistribution which is making benefit for microbreweries could support the moderate market growth.
The Brewers Association is dividing craft producers into two groups, namely brewers with high and moderate rates of hop intake. The first group with consumption rate of 1.5 pounds per bbl includes all restaurant and microbreweries, as well as breweries that were purchased by large companies (Goose Island, 10 Barrel, Elysian, St Archer, and others), and some original regional breweries. The second group of those who use 0.43 poгnds per bbl contains mainly regional companies many of which have cut down their sales and share in the craft segment (D.G. Yuengling & Sons, Boston Beer Company, Minhas etc).
Besides, we can see that the hop consumption in the USA can be supported by supergiant AB InBev, which has reinforced its premium portfolio members by buying 10 craft breweries over the last year.
And the company is rather active not only in the USA but in the global hop market. Specifically the report for 2016 contains information concerning cooperation with farmers in Rio Negro province (Argentine) that grow hop for the company. And in summer 2017, American craft brewers announced that they no longer could purchase raw material from RSA. After AB InBev acquired SABMiller the company got control over the South African hop acreages. And now the crop is aimed to AB InBev needs. Possibly this just a way the company is diversifying supplies in order to be less dependent on weather conditions and large hop producers in case of demand and price fluctuations.
Germany: plans vs weather
The hop market development may seem a moderate search for the balance compared to the “big dipper” in the USA. This is certainly due to the wide sales geography and a more predictable beer market of Western Europe. The character of acreage changes in the USA and Germany is similar in general but the rates of growth and decline differ dramatically.
The current situation in Germany can be described as moderate expansion of acreages, which follows the hop demand increase at middle gear. The upward cycle began in 2013 (after a three year decline period) and has been continuing evenly without any spikes. According to IHGC in 2017 the acreage increased by 5% to 19 543, having exceeded the maximum of 2008.
Another significant difference between Germany and the USA is that European brewers are focused on the classic tastes. That is why in Germany the share of alpha varieties amounting to 42 % is twice bigger than in the USA. That is why the situation in the market can be estimated by conventionally pooled volume of alpha acid production.
Historically, Hallertau valley located in the North of Bavaria has been the major region of hop cultivation area. Hallertau is listed as the largest continuous hop-planting area in the world. In the net volume of hop harvest crop, its share equals to about 85%. Other large hop planting areas are located in the East of Germany along the Elba and Saale rivers (7% of the national harvest crop). The most eastern hop cultivation areas are located at the border with Switzerland in the neighborhood of Tettnang where mostly aroma hop varieties are grown (5%). Besides, there are small planting areas near Bavarian city Schpalt (2%).
The localization makes the national hop production strongly dependent of the weather fluctuations in the North of Bavaria. In 2017 despite the volume growth of harvested hop near Tettnang, the Elba-Saale and Spalt, the reduction in Hallertau determined the negative result.
Over 2013-2017, Germany increased the cultivation areas of both aroma and alpha hop varieties. Yet while alpha varieties increased by 1.8% per year, aroma varieties grew by 3.9% YOY. That resulted from growing popularity of craft and unusual beer. However over the last couple of years the growth dynamics have become equal.
Finally the third thing that significantly differs the USA and Germany is that German hop producers are focused on export more than on the domestic market. The bulk of German hop is bought by transnational companies. For example, having the total hop crop of 42.8 tons in 2016, Germany exported 22.8 tons of finished hop products. But the export share can amount to 60% of the output if we take into account a deeper processing of exported hop products. The broad geography of German hop supplies levels down local fluctuations of demand and makes the business more stable.
The producers’ cautiousness in managing their planting areas and constant balancing between demand and supply makes the market more responsive to unforeseeable external factors. In the first place to weather that brought about strong fluctuations of hop crop yield in the recent years. Hop is quite sensitive to drought in June-July, and on the global scale the climate is growing hotter. The poor crops in 2013 and 2015 let to stock depletion, hop deficit and price increase. The negative effect was partially diffused by good crops in 2014 and 2016.
However, constant volume fluctuations made futures contracts for 5-10 years quite usual as well as the narrow spot market. The share of contracted German hop as well as contract terms are rather big according to IHGC data. In 2017 more than 90% of harvested crop was sold out for four years ahead. Yet, the proportion of contracted and instantly traded hop fluctuates depending on harvest crop and alpha acid content. For example by the poor harvest of 2015, the share of contracted hop increased to 105% of the harvested volume and only 78% in conditions of overabundance in 2016.
Contracted hop share in Germany as % of crop in year N
| Contract | Year N | Year N+1 | Year N+2 | Year N+3 | Year N+4 | Year N+5 |
| 2017 | 92% | 98% | 94% | 91% | 67% | 61% |
| 2016 | 78% | 82% | 80% | 71% | 65% | 37% |
| 2015 | 105% | 105% | 99% | 94% | 73% | 65% |
| 2014 | – | – | – | – | – | – |
| 2013 | – | – | – | – | – | – |
| 2012 | 82% | 74% | 56% | 37% | 17% | 10% |
| 2011 | 80% | 75% | 70% | 53% | 34% | 15% |
In 2017, the market can be called balanced and the curve of futures share, according to November data by IHGC is located between the curves of bad 2015 and plentiful 2016. Possibly, the contract share could be not so big, but 2017 turned out to be stressful for hop producers and buyers. At August IHGC conference in Yakima a pessimistic prognosis as for hop crop in EU in 2017 was published. In this season there were indeed many issues for concern.
Johann Pichlmaier, president of German Association of Hop Growers complained that in April there occurred late cold spells that damaged the sprouts, July was dry, besides hop acreages were attacked by hail and spider-mite infestation (in hot weather it reproduces particularly actively). If the drought had persisted for a week or two longer, the crop would have been very bad, but it was saved by rains at the end of July and August. Such newsreels must have evoked fears of getting no hop.
Johann Pichlmaier said that since the share of production that was already contracted in 2017 was high, prices for remaining hops on the spot market were likely to rise unless final production was considerably higher than forecast. And by November as the situation became more clear, the current market prices for hop especially for alpha varieties did increase.
On the one hand the fears have not panned out – the crop harvest of 2017 turned out to be comparatively good as late rains saved it. According to November data of DHWV German hop growers managed to produce 41 556 tons of raw materials which is only 3% below the result of plentiful 2016.
On the other hand, due to the dry weather alpha-acid was considerably lower than the average, though it differed from region to region. The volume of alpha-acid at November IHGC conference in Prague was approximately estimated at 4200 tons which is 12% lower than in 2016.
According to Peter Hintermeier, DHWV chairman due to hop productivity fluctuations in different regions of Germany and low content of alpha acid brewers will have to buy some quantity of the raw materials on the spot market, as not all hop producers will be able to fulfill their contract provisions concerning alpha-acid in full. That is why Peter Hintermeier expects 2018 to be a difficult year for brewers.
Czech Republic: classic monohop
Speaking of Czech hop one usually means aroma variety Saaz (Czech name Žatecký poloraný červeňák). This is no wonder as its share usually exceeds 80% of the total hop crop. Such situation was formed historically as till 1996 in the Czech Republic there was a restriction to other varieties cultivation.
Saaz is mainly planted near the same-name city Žatec (Germ. Saaz) which is located on the north-west of the biggest region in the country, Bohemia. The content of alpha-acid in Saaz hop is low by definition (2.5-4.5%).
Similar to German producers, Czech hop-growers export the bulk of their output. And similar to Germany, the supply volumes stay at approximately the same level whatever the crop year was. For example in disastrous for hop growers 2015, export reached 3 742 tons and the inner market got just a little of hop, while in record breaking, 2016, 3 906 tons of hop were exported. The comparatively long shelf life of hop pellets (2 years by normal temperature and up to 5 years by low temperature) makes it possible to fulfill the contract supply obligations.
Contracted hop share in Czech Republic as % of crop in year N
| Contract | Year N | Year N+1 | Year N+2 | Year N+3 | Year N+4 | Year N+5 |
| 2017 | 100% | 100% | 100% | 95% | 80% | 75% |
| 2016 | 100% | 100% | 100% | 95% | 90% | – |
| 2015 | 100% | 100% | 100% | 99% | 90% | 85% |
| 2014 | 100% | 100% | 100% | 98% | 90% | 75% |
| 2013 | 100% | 100% | 98% | 95% | 75% | 65% |
| 2012 | 100% | 95% | 85% | 80% | 55% | 50% |
| 2011 | 85% | 70% | 60% | – | – | – |
Besides we should also note the extremely high proportion of contracted hop crop. According to IHGC, the contracts were growing ever longer and since 2014 the crops have been sold out by futures three year ahead (2017 was not an exclusion). However, the bulk of the fourth and fifth year crops already belongs to somebody too.
This is because large companies that always use Saaz variety by brewing famous classic brands have long ago become the major purchasers for Czech hop growers. The biggest hop shipments are sent to Germany, China, Japan, Russia, and Belgium. These five countries in 2016 accounted for 81% of export.
In 2013, the long lasting trend of hop acreages reduction ended and there started growth of YOY 3.6% at the average. In 2017, the acreage in the Czech republic has grown by 3.5% to 4 945 ha. This expansion concerned almost exclusively Saaz variety, that increased its acreage by 125 ha while the total additional acreage amounted to 170 ha.
According to data by Central Institute for Supervising and Testing in Agriculture (CISTA or ÚKZÚZ) in 2017, the weather differed considerably over the vegetation period and by regions. Olomouc region (Tršice fields) got the least of precipitations, while in Ústecký region near Saaz precipitation helped to improve the crop close to the end of the season.
If the share of late hybrid varieties (such as Kazbek and Saaz Late) had been bigger, they could have mitigated the negative dynamics. But as early variety Saaz dominates, the crop has declined by 13.5% to 4 287 tons. The Czech hop crop in general fell by 11.9% to 6 797 tons. That is why in 2017 the share of Saaz variety in the total volumes declined to 63%.
Despite the two digit volume decline, CISTA does not find the situation negative. As the harvest crop decreased against the background of the record breaking 2016, the hop growers are generally satisfied. The crop volume of this year is still bigger than the average and will probably be completely sold out.
Germany still dominates the Russian market, yet over the recent two years one has been able observe a continuous success of Czech hop suppliers. Their expansion and growing popularity of hops from the United States became the drivers of supplies growth in 2016 despite the preceding modest harvest crop in the EU, as well as the factor of relative stability in 2017. In this connection, in 2017, the ratio of the varieties continued to shift towards the aroma ones, and the supplies of Magnum hop and other alpha varieties were reduced. However, the import of bitter hop pellets is partially replaced by extracts, especially from the major beer manufacturers. Total volumes of alpha acid supplies, according to our estimation, decreased by approximately 5% and returned to the level of 2015. Barth Haas Group continues dominating the hop products market; HVG also increased its weight. At the same time, Morris Hanbury significantly reduced the supplies in 2017.
- What and how affected the domestic market
- Pattern of imports of hop pellets
- Alpha and Aroma
- Hop extracts
- Own production: not much so far
- The volume of alpha acid
What and how affected the domestic market
Russia’s demand for hops is almost fully satisfied with imported supplies, the levels of which are constantly fluctuating. Because of the uneven import dynamics short term changes may not reflect changes in demand. Estimates should only be given for long time intervals. For example, it is possible to speak of a serious decline in supplies after 2008, which was caused by crop failures, price rally and reduction in beer consumption. We can also talk about the subsequent rapid (but partial) recovery of the hop consumption.
Another leap and correction have occurred over the recent three years. But the dynamics will look smoother if you put aside 2014, when the ruble devalued and the import of any goods dropped. Then we can speak of stabilization and say that, probably, volumes of supplies are included in the corridor of fluctuations of 3000 – 3500 tons per year and will not be growing or decreasing.
According to the information portal Marketing1.ru, for the first three quarters of 2017 the import of hop cones and pellets decreased by 5%. As a rule, the main hop volumes arrive to the market in the period from March to July, nevertheless it can be expected that the whole year’s results will be a little better because of the relatively low base at the end of 2016. In addition, preliminary 2017 results should be assessed taking into account the relatively complex pattern of hops consumption:
- In recent years, there has formed a trend of gradual replacement of hop pellets with liquid extracts. Primarily, this change affects the alpha varieties, although the sales pattern of aroma hops also becomes more difficult. Therefore, reducing the supplies of hop pellets in itself does not mean less demand for hop products. Import of the extracts will be discussed below.
- Also in recent years there has been a fairly rapid reduction in the supplies of alpha hops, both in absolute terms and as a proportion of total volume. Conversely, the absolute volumes of aroma varieties were growing up, which was particularly noticeable in 2017.
- Dynamics of hop purchases has varied depending on fluctuations of yield and prices in the regions of cultivation. In 2017, Russian brewers could use the supplies of German and Czech hops with a long shelf life, contracted and/or imported in the previous years. Conversely, supplies of aroma varieties increased, which was associated with an excess in the US market, as well as with the popularity of the German and Czech aroma hops.
- A sharp increase in the supplies of hop pellets and extracts in 2016 was not supported by adequate beer market recovery due to ban of big PET packaging. This is another reason why in 2017 the brewers could not actively form stock, spending the surplus of the previous year. Although from August of 2017, we can talk about stabilization and even the transition to the slow growth of beer production.
- Although 90% of the Russian hop market is formed by imports, sharp fluctuations in production in the Chuvash Republic still influence the outcome of the hop trade balance. That is exactly what happened in 2017, when the crop yield was much higher than the previous season.
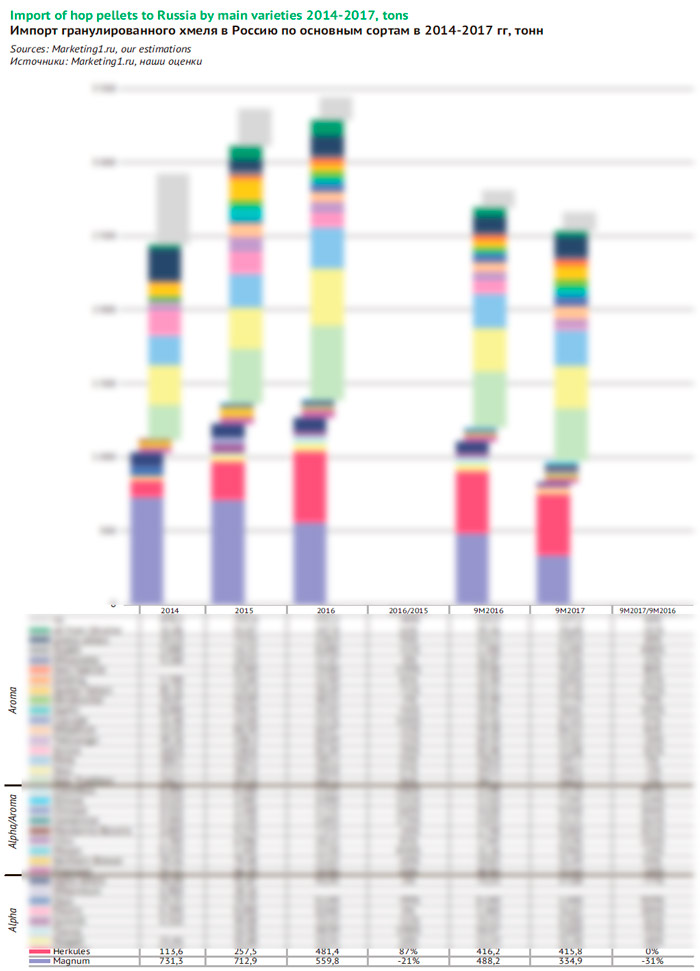
Pattern of imports of hop pellets
In geographical terms, we can say that Russian brewers focus on German and Czech suppliers, while hops from the USA started gaining popularity only in recent years. The geography of hop imports in 2016 and the reporting period of 2017 has somewhat changed.
Germany, despite being a major hop supplier, had no significant influence on the market dynamics in 2016-2017. According to Marketing1.ru the imports from Germany did not fluctuate very much – in 2016, it decreased a little, and in 2017 increased approximately by the same amounts. These fluctuations are easily explained by the poor harvest in 2015 and a good one in 2016.
But the Czech Republic due to strong supplies growth was not only a growth driver in 2016, but also provided relative stability in 2017. As we have said, Czech hop growers are able to maintain the volumes of overseas contracts regardless of the fluctuations of the current yield crops.
A markedly negative impact on the hop import was caused by a decline in supplies from the UK in 2017. A strong positive effect in 2016 and a moderately positive one in 2017 were exerted by the supplies from the USA. Also note the reduction in imports from Slovenia, which continues for the second year in a row.
Approximately …% of imports of hop pellets is provided by three market leaders – Barth Haas Group, Hopsteiner and HVG, which directly or with the participation of their trade partners import to Russia almost the entire volume of alpha hops and are the largest suppliers of aroma varieties.
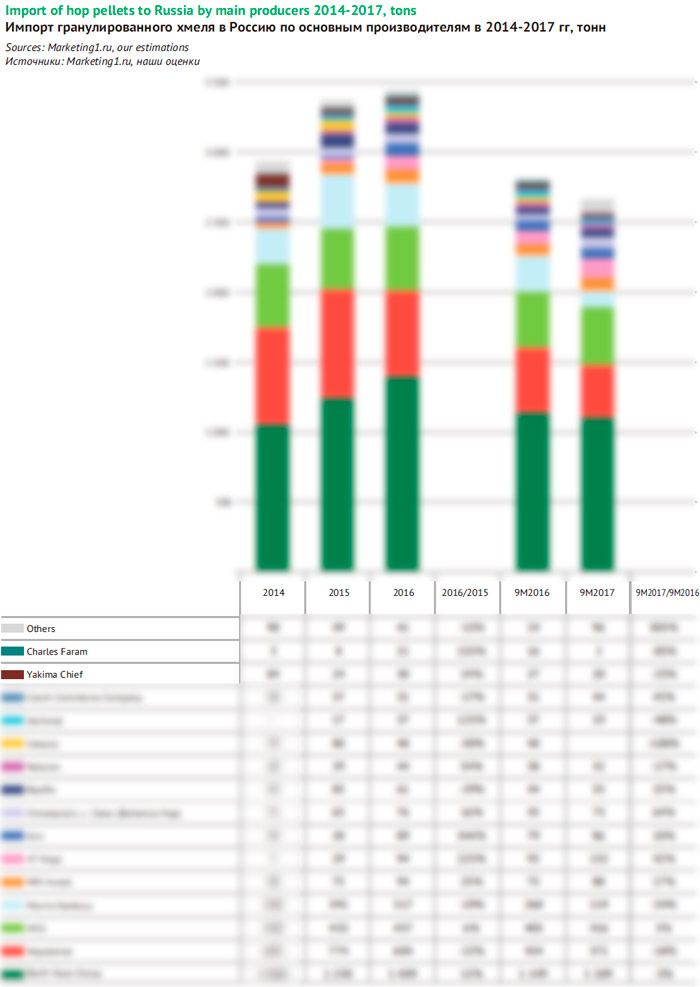
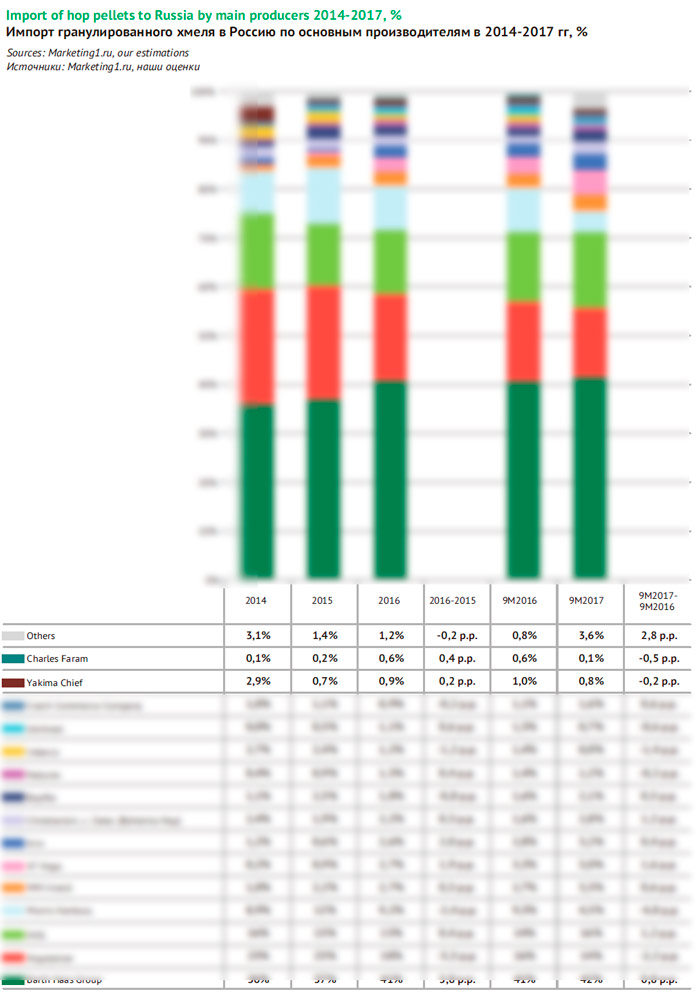
The absolute leader is the company Barth Haas Group, which have gradually increased its share in recent years and now controls about …% of the market. Hopsteiner since 2015 has been reducing its supplies volumes and share of total sales (about …% in 2017). However, this reduction was compensated by an increase in the supplies of hop extracts (see below). As a result, the second position in the list of hop pellets market leaders is now occupied by the company HVG with a share of about …%. Morris Hanbury’s share in 2017 decreased markedly (which is linked to a decline in imports of British hop), although it may be temporary “fluctuations”. Other manufacturers control … of sales of imported hop pellets, mainly supplying aroma varieties.
Buyers of hop pellets can be divided into three groups: trading companies (including representative offices of hop producers), federal brewing companies and a great number of regional breweries. In this hop purchase structure lately there have been some changes of the members ‘ share.
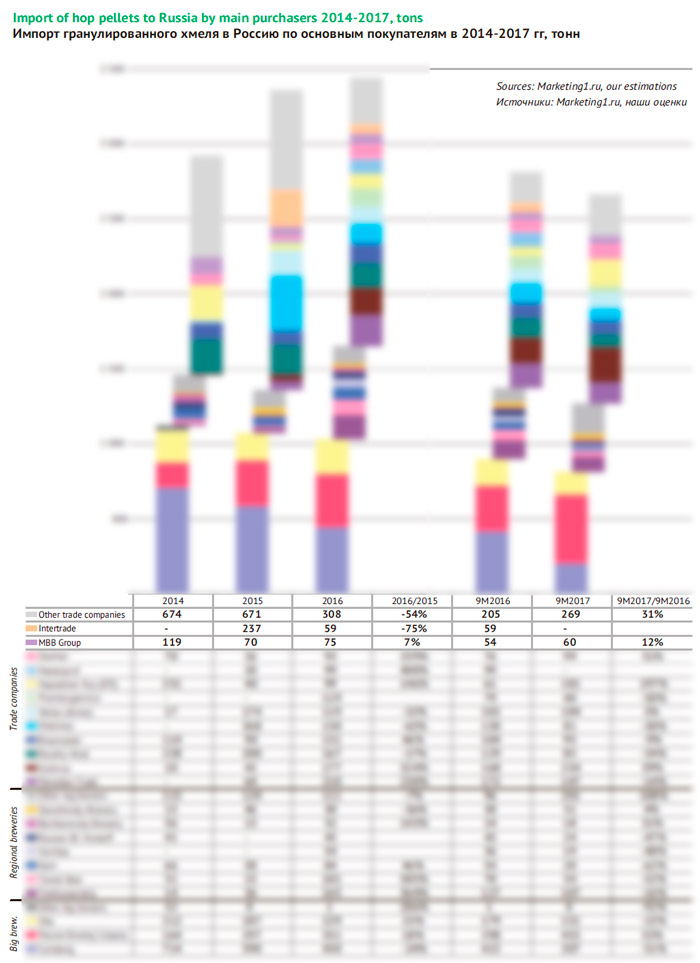
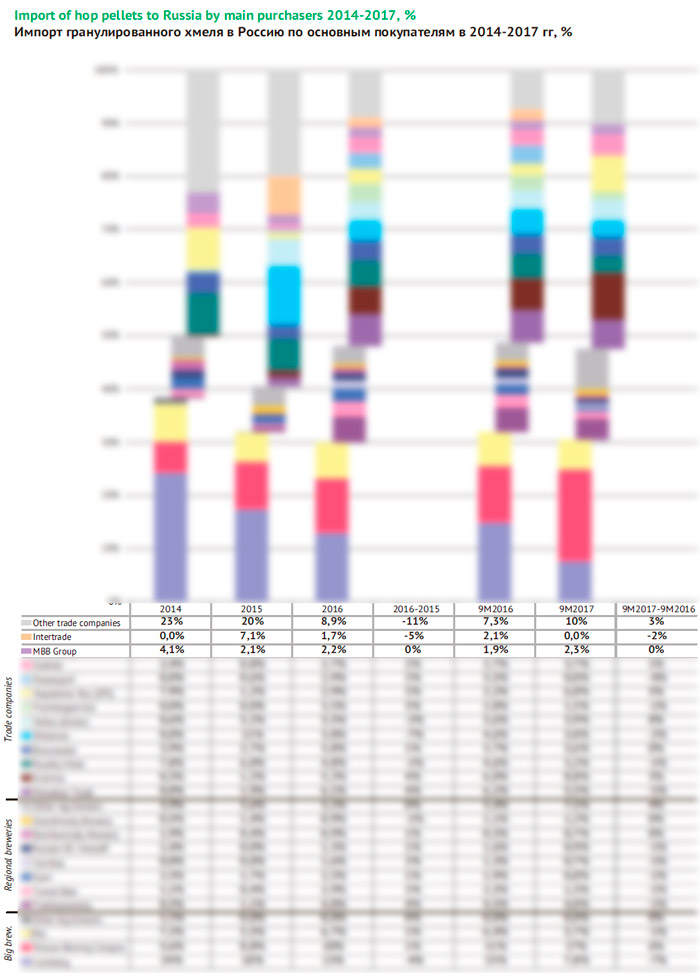
About … of the hop pellets will potentially accrue to traders, and this share is fairly stable, except for temporary growth in 2015. The share of regional breweries in 2016-2017 increased by about a …, up to …%, which can be explained by the increase in the volume of direct import, without the participation of Russian intermediaries.
Among the largest brewing companies the main direct hop buyers are Carlsberg Group and …, also noticeable amounts are bought by …. That said, … is buying more and more hops while …, vice versa, has been quickly reducing the volume of direct imports since 2016 due to the substitution of hop pellets by extracts.
The pattern of supplies to trading and logistics companies, and also representatives of hop growers has been constantly changing as well as the shares of these companies. If we omit logistics companies, than the largest buyer of hop pellets in 2017 is the company Grainrus, which works in close cooperation with the German …, purchasing about …% of sold hop from it. Grainrus also received a relatively small amount of Saaz hop from the Czech … and from the United States.
Major suppliers of German raw materials from the leading three manufacturers are the companies Russian Hop and Braumeister. On a practically exclusive basis, performing the representative function of …, operate the companies Shtelmos and Hopsteiner Rus, the latter is, in fact, beginning to play a key role. Also among the major suppliers we should highlight the company Gelios (Almek), which largely focuses on the hops from … (but also sells hops of …) and the Russian representatives of Doehler (hops of …).
Alpha and Aroma
During 2014-2017, the proportion of aroma varieties increased in the total import volume of hop pellets. If we omit the supplies of hops with unknown characteristics, than in 2014 the proportion of aroma hops (plus aroma with a high content of alpha-acids) was 58%, in 2016 – …%, and over the first three quarters of 2017 it was …%.
In total for 9 months of 2017 supplies of aroma hop varieties increased by …% and supplies of alpha varieties decreased by a …, according to Marketing1.ru.
Bitter hop in Russia is almost fully imported from Germany, the share of other countries has been declining and in 2017 was less than …%. But the pattern of the aroma hops supplies has been changing all the time, and Germany now doesn’t dominate so completely. German hop was a key contributor to the sharp increase of category in 2015 and influenced its increase in 2017. American aroma hop has grown significantly by volume over the 2016-2017. Supplies of aroma hops from the Czech Republic in 2014-2017 were quite stable.
To the greatest extent the share drop of bitter hops was affected by the reduced supplies of the main variety – Magnum (…% during the reviewing period of 2017). For a long time, it has been the leader in the pattern of Russian import, but now has moved to the second position, giving way to aroma variety. Even more dramatic was the reduction in the supplies of …, … and … varieties. Only the volume of import of … hop remained approximately at the same level that looks good on the background of the entire category. However, the trend of substituting Magnum variety with … variety formed a long time ago, and exactly … was the main driver of growth in the supplies of alpha hops in the previous years.
The three largest varieties of aroma hops quickly gained weight since 2014 and have been relatively stable over the 9M2017. German Hallertau Tradition became the leading hop supplier (having exceeded bitter Magnum), although the volume in relation to 9M2016 was virtually unchanged (-…%). Also practically at the same level was the import of Saaz hop due to the termination of supplies from the UK (-…%). At the same time there was a slight increase of volume and share of the … variety, which is mostly delivered from Germany (+…%). Note that during 2014-2016 the supplies of these varieties were constantly and rapidly growing. On the contrary, … variety, which was once popular, became an obvious outsider. Also for 9M2017 the supplies of … hop decreased. The total increase in the category of aroma hops was provided by a lot of varieties, because in contrast to the alpha hops, the pattern of supplies is less consolidated with a wider available range. Particularly high was the contribution of German varieties Spalter Select, …, …, … and dual-propose Northern Brewer.
It should be noted that aroma hops, by the nature of their use, often come in small batches and in private, especially if we are talking about craft brewers. It is unlikely that these volumes are very large, but it is impossible to estimate them, and the real volumes of import of aroma hops are above the official ones.
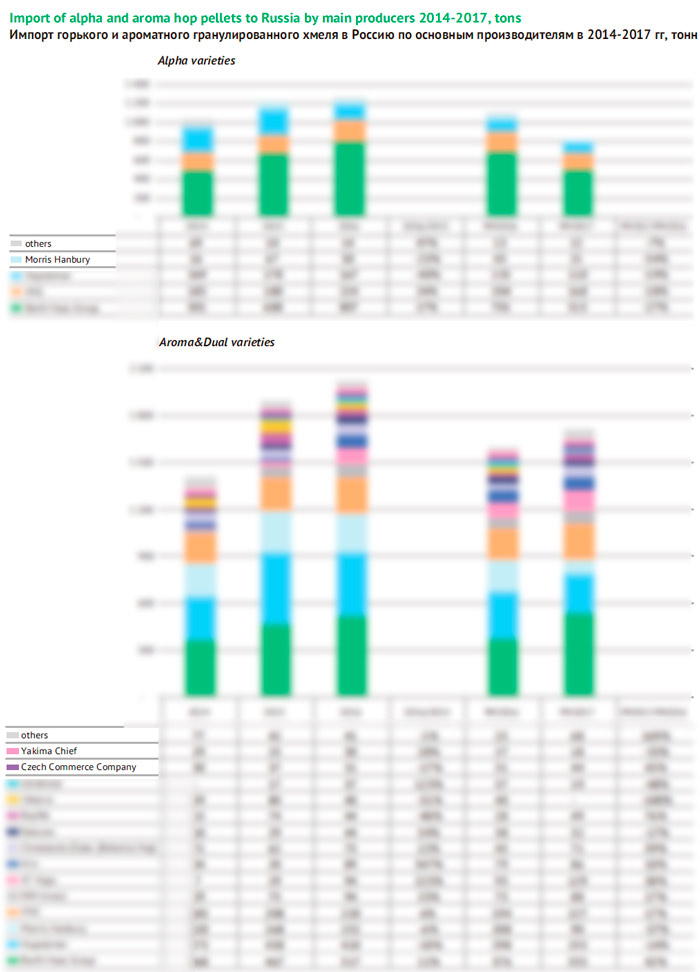
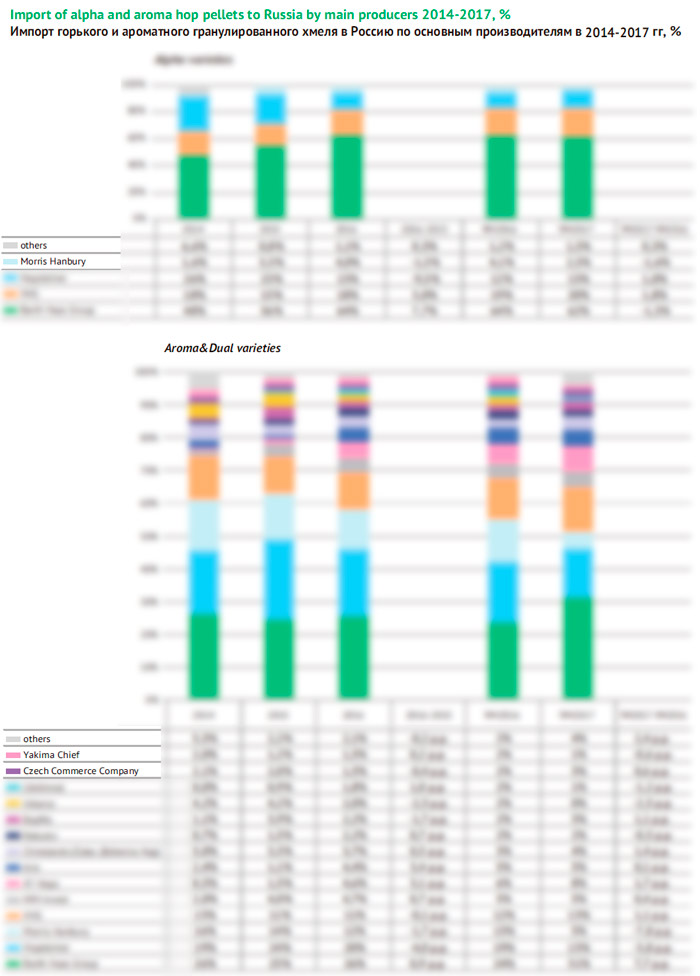
Supplies of alpha varieties of hop pellets is highly consolidated – three major companies account for about …% of imports. Moreover we can talk about the trend of increasing their weight and pushing other providers out of the market.
Almost … of the imported bitter hops are accounted for by the Barth Haas Group. The company has been increasing its supplies at an impressive pace until 2016, progressively establishing itself in the position of a market leader. Based on the data for 9M2017 it can be expected that by the end of the year the supplies will return to the level of 2015, but it can be considered a good result. Import volumes of the company Hopsteiner started to decline in 2015 and continued throughout the period under review. Company HVG has increased the supplies of bitter hops in 2016 and reached the second position in the category. For 9M2017 its supplies decreased less than other major market participants, and its share rose up to …%, in our estimation.
Sales of the aroma varieties of hops (and also dual-propose hops) are consolidated to a lesser extent, and there are no monopolists. Here, on the contrary, there is a clear trend of expanding the number of market participants as well as range. We can say that this process stabilizes the hop market nowadays.
Despite the overall increase in imports, only two of the major market participants continue to increase the supplies. The greatest impact was made by the Barth Haas Group, which is increasingly becoming the leader in the aroma hops segment. According to our estimates, the company had controlled about a … of supplies by 2017, increasing them in line with average growth, but by the end of 2017, its share will grow significantly. At the same time, the company Hopsteiner has been reducing volumes of supplies for the second year. The most dramatic reduction in the volume and proportion of supplies in 2017 was observed at Morris Hanbury. The third place is occupied by the company HVG, which methodically and continuously increases its presence and it can take the second place in the list of aroma hops suppliers by the results of the revised year-end 2017, or in the near future.
In general, multidirectional dynamics led to a reduction in the proportion of 4 market leaders in 2017 in the categories of aroma and dual. Most of the small companies with volumes of 30 – 100 tons have increased supplies. Although one of the most notable suppliers of the second row is a company 47Hops from the United States, which has declared bankruptcy (see above). Noticeable success was achieved by a number of Czech hops suppliers: MM-Invest, Arix, Chmelarstvi – cooperative Zatec (Bohemia Hop) and Czech Commerce Company.
Hop extracts
Against the reduction of hop pellets supplies, in 2016 the supplies of hop extracts increased markedly. For the gradual replacement of some hop products by others there are a number of objective reasons.
First of all, it is their price. For example, in 2016, one of the market leaders imported several batches with a volume of 1-3 tons of Magnum sort extract, its price was … dollars per kilogram with 45% concentration of alpha acid. At the same time, 4 tons of Magnum hop pellets with 13.6% concentration of alpha acid cost about … dollars per kilogram. That is, the alpha acid contained in the concentrate was worth $…, and in hop pellets – $… per kilogram.
In addition to the increasing availability of extracts their appeal is growing thanks to the ease and duration of storage. For example, in 2017 Russia received extracts including those produced from the 2012 harvest. Here we must note that the bulk of import volume consisted of fresh extracts produced in 2016, and the cost of “old” extracts was lower. Anyway, long term storage allows brewers to efficiently manage their stocks and form them in periods of low prices for raw materials.
Finally, craft brewers are increasingly moving away from the stereotypes that hop extracts are used exclusively in mass production, to simplify and cheapen the process. The form of iso-alpha acids gives a technological advantage in the production of beer. But there is also an emerging fashion on extracts with a high content of beta-acids, which are used instead of aroma hop pellets.
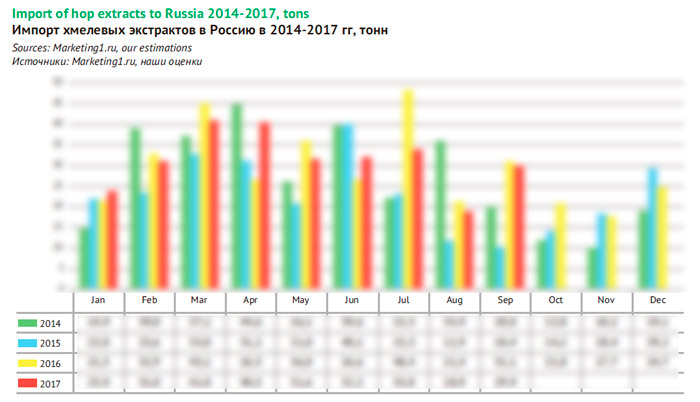
For the first 3 quarters of 2017 the import of extracts in Russia decreased by …%, which can be considered a very good result given the high base of the previous year. As for the hop pellets, the bulk volumes of extracts usually comes in the period from March to July. Therefore, according to preliminary year-end 2017 the import of extracts can be estimated at bout … tons.
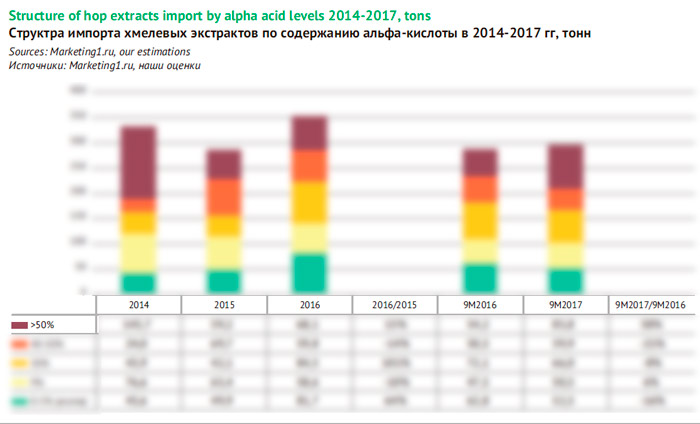
The pattern of extracts supplies, depending on the content of iso-alpha-acids, is constantly changing. In 2014, approximately … of the extracts were delivered with a high content of alpha acid (40-62%). In 2016, there was a significant increase in the proportion of aroma extracts and extracts with a …% content of alpha-acids with constant volumes of extracts with high concentrations (…%). According to our preliminary estimates, in 2017 the proportion of extracts with a content of alpha-acids over …% will increase markedly and the proportion of … extracts will be slightly reduced.
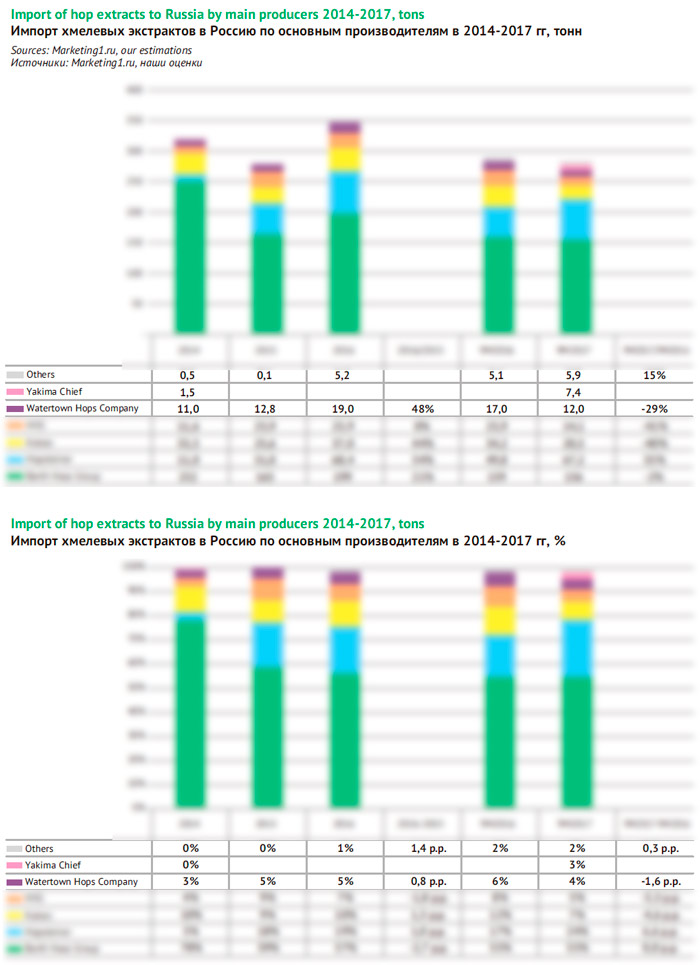
The key extracts supplier with a share of about …% is still Barth Haas Group. However, growth in 2016 and its prolongation into 2017 were largely achieved due to the increase of the supplies by Hopsteiner. Today, the company’s share can be estimated at about …% of the total. The weight of other hop extracts suppliers is constantly fluctuating, but among them only the German HVG and American Kalsec stand out. It’s also possible that Yakima Chief the largest producer of hop products from the USA will be included in the list of the key suppliers of extracts.
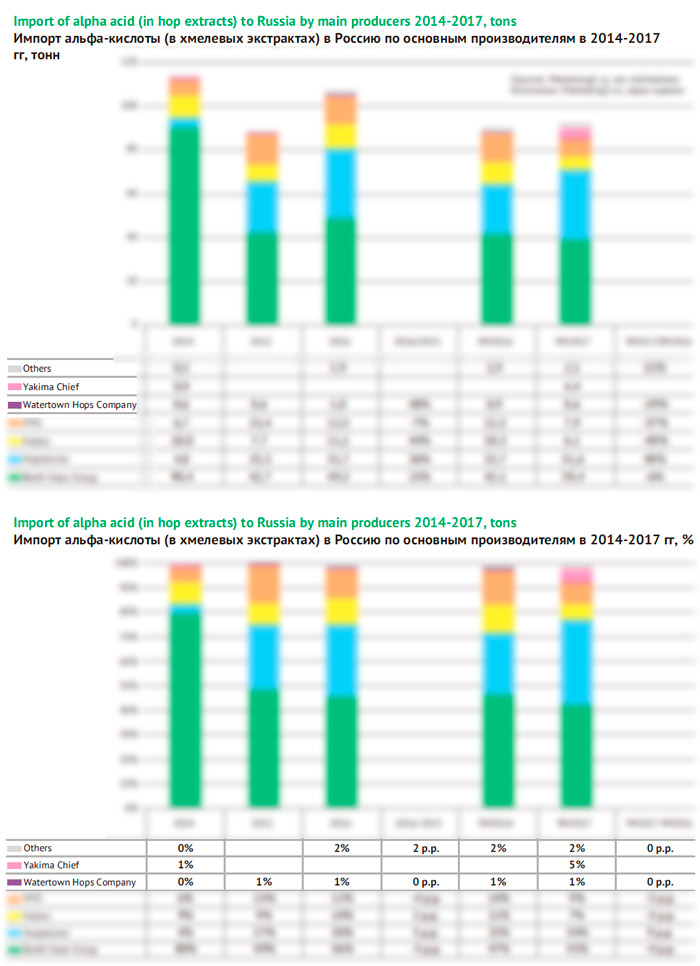
Since the main component of the imported extracts is alpha-acid (or more often iso-alpha acid), for the correct evaluation of extracts import it is necessary to compare its volume. The volume ratio of alpha-acid varies considerably depending on the supplier and the type of extract, usually fluctuating in the range of 30-60%. According to our estimates, in 2017 the supplies of alpha-acid in the extracts were not reduced, but rather slightly increased. For the year their estimated volume is around … tons.
As in the previous estimate, by the volume of import of alpha-acids Barth Haas Group clearly dominates, but the company’s share in 2015 did not exceed …%. At the same time, the importance of Hopsteiner has grown significantly and today the company accounts for about a … of the supplies of alpha acid in the form of extracts. Also in terms of the alpha acid the weight of HVG and Kalsec became higher.
The pattern of hop extracts import has a high proportion of direct purchases by breweries. Until 2016 approximately equal volumes of extracts were supplied by Carlsberg and Efes, and together they provided half of imports. But in 2016, Carlsberg has sharply reduced the direct purchase of hop pellets and increased the purchases of extracts, and now its share is about one third of the total. Also in 2017 the total share of many small buyers significantly increased.
If we convert the volume of direct extracts purchases into the conditional alpha-acid the share of Carlsberg and … will be lower, but in the meantime, the list of significant buyers- brewers will include … .
Own production: not much so far
Industrial hop cultivation on the territory of the USSR started developing in the 1930s, when first plantations on pole hedges were created. By the time Soviet Union collapsed, the needs of Russian brewers were fully met by hop production in Russia and Ukraine (part of Ukrainian hop was even exported). The main Russian region producing hops is the Chuvash Republic (95% of the total crop), small crop acreages are preserved in the Altai territory and the Mari El Republic.
Intensively the hop growing in the Chuvash Republic began to develop in 1922, providing its products to almost all Russian Breweries. So it went until the turning point of 1993, when the Republic with 2 700 hectares of hop gardens collected 3 200 tons of dry hops. But just that year, according to hop growers, Russian brewers have begun to buy imported hops, which was the reason the harvest remained unclaimed. Next year a continuous decline in the production of hops began in Chuvashia. The main cause of the crisis, according to hop growers, was that the Republic at that time produced almost no hop pellets and extracts, and sold pressed dry hop cones with a short shelf life.
Further consolidation of beer market in the hands of international companies has led to almost complete transition to standard varieties of imported hops. The lowest point was reached in 2010, when the area of hop plantation was only 242 hectares, and, moreover, because of bad weather in that year a total of 23 tons of hops were collected.
Today, the situation has improved markedly. Manufacturers purchased equipment for the processing of hops, and the area of cultivation increased. The restoration of industry has been greatly influenced by the relatively low cost of hops after the Russian ruble devaluation, subsidies for harvested hops, and a general policy of import substitution.
The most widespread plantations are of three varieties of hops. They are aroma hop “Moskovskiy ranniy” (alpha acid content of 3-5%) and “Istra” (4-4.5%), as well as dual propose “Podvyaznoy” (5-8.7%).
The Chuvash Republic has a total of 5 farms cultivating hop. According to reports of the largest producer “Chuvashenergo”, in 2016 its revenue grew by 68% to 45.5 million rubles. In the same year a powerful new line of hop pelletization was put into operation.
The main factors that influenced the volume of hop production in the Chuvash Republic in recent years have been weather, introduction of effective agricultural technologies and acreage growth.
The record year for the Chuvash Republic was 2015, when farms of all categories with the average yield of 18.1 centners/ha collected 418.8 tons of hops (the total Russian harvest amounted to 438.4 tons).
2016 was unsuccessful due to lack of precipitation and high temperature during the growing season. The yield was 13.9 centners/ha and the gross harvest was 324 tons. The area for hop cultivation amounted to 309 ha, and 27.5 ha of new hop gardens were laid.
At the time of preparation of the article Chuvashstat has not yet published the official data on the results of 2017. But according to the evaluation of the Ministry of agriculture of the Chuvash Republic, the crop yield was good, 16.5 centners/ha. Given the previously planted areas the gross harvest in the Republic could reach 400 tons. In general, the Russian harvest could reach 430 tons, by our estimate.
Based on our assessment of the volumes of gross hop yield and trade balance, the share of Russian producers on the domestic market since 2011 fluctuates at around 10%, but will probably increase in the future. At the same time, due to specialization in the production of aroma varieties, today we are not talking about significant volumes of Russian production of alpha-acid. Its approximate capacity is 17 tons per year.
The volume of alpha acid
The accuracy of the calculation of alpha acid market volume is complicated by the fact that Russia imports hop pellets of different harvest years at the same time. Since the content of alpha-acids in it varies depending on weather conditions, for our calculations we used the average values specified for specific varieties, multiplying them by the supplies volume.
Market volume was identified as a result of the trade balance, which summed up the calculated amount of alpha-acid in imported hop pellets, imported hop extracts and hop produced in Russia minus exports. However, we did not account for carryover stocks that could be formed by the Russian trading companies.
Major market fluctuations were associated with the dynamics of the supplies of hop pellets. As mentioned above, after the growth restoration in 2015, and growth “in advance” in 2016, in 2017, the imports decreased. Meanwhile the supplies of hops with a high content of alpha-acids in 2016 almost didn’t grow. Total import volumes increased thanks to aroma varieties and to a small extent – varieties for dual-purpose. So today, the average content of alpha-acid in imported hop pellets (and pressed cones) is lower than it was a few years ago.
For this reason, the estimated supplies volumes of alpha acid in hop pellets in 2016 amounted to … tons with a growth of just …%. The decline of supplies of alpha acid by the end of 2017 is approximately …%, down to … tons.
We also noted that in recent years there has been substitution of imported hop pellets by extracts. In 2016, the official volume of alpha-acids in the extracts increased by …% to … tons. In 2017 the volume of imports of extracts decreased (based on data for the first three quarters) by a …, but the proportion of extracts with a high content of alpha-acids has increased. As a consequence, the volume of supplies of alpha-acid in the extracts probably rose by …%, to about … tons.
In connection with an increasing yield of hops in the Chuvash Republic, obviously, the production of alpha acid also increased. According to our estimate, after a decline of …% in 2016, in 2017, they increased by …% to … tons.
The export of hops from Russia (previously imported), while it is growing, is far too small to significantly affect trade balance. In 2017, the volume of exports in the form of alpha-acids can be estimated at … tons.
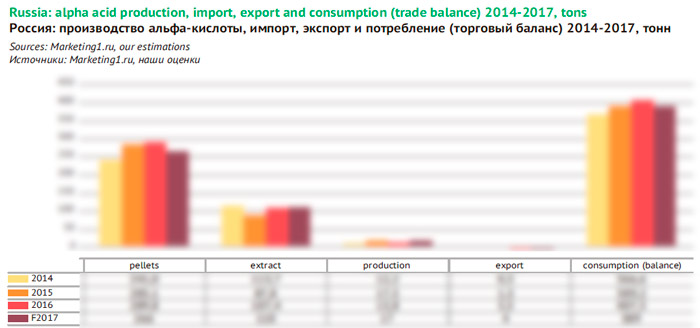
Thus, the multidirectional dynamics of the imports of hop pellets and extracts determined the end results of 2017. According to our preliminary estimates, the total amount of alpha-acid received by Russian companies decreased by …% to … tons. In other words, it returned approximately to the level of 2015 after modest growth in 2016.
The article materials were prepared using statistics of import supplies provided by company Marketing1.ru (http://marketing1.ru/), and also the data from national statistical services and industry unions:
The chapter on the world beer market used the data from the International Hop Growers Convention, Food and Agriculture Organization of the United Nations, and also Barth Haas Group analysis reports.
Besides the following information sources were used: The Brewers Association and United States Department of Agriculture (National Agricultural Statistics Service) in the chapter on the USA hop market; Deutsche Hopfenwirtschaftsverband in the chapter on hop production in Germany; Ústřední kontrolní a zkušební ústav zemědělský in the chapter on hops production in the Czech Republic; The Ministry of Agriculture of the Chuvash Republic and Chuvashstat in the Chapter on hops production in Russia.
The data on the market volumes and their interpretation are our assessment based on calculations and the current trends in case the source has not been named.
We do not claim the given information to be absolutely correct, though it is based on data obtained from reliable sources. The article content should not be fully relied on to the prejudice of your own analysis.
To get the full article “Global hop market. Hop Market in Russia.” in pdf (51 pages, 38 diagrams, 3 tables) propose you to buy it ($40) or visit the subscription page.
2Checkout.com Inc. (Ohio, USA) is a payment facilitator for goods and services provided by Pivnoe Delo.