
The revenue of Chinese Tsingtao Brewery Co., Ltd in 2015 amounted to 27.63 billion yuan which is 4.87% less versus the previous period. And the net profit decreased by 20.18% to 1.612 billion yuan.
As the net profit of the company consists of incomes from different regions, let us consider which of them had the biggest impact on the financial performance.
The biggest decline was observed in Dongnan Region which is responsible for production and distribution in Southeast China.
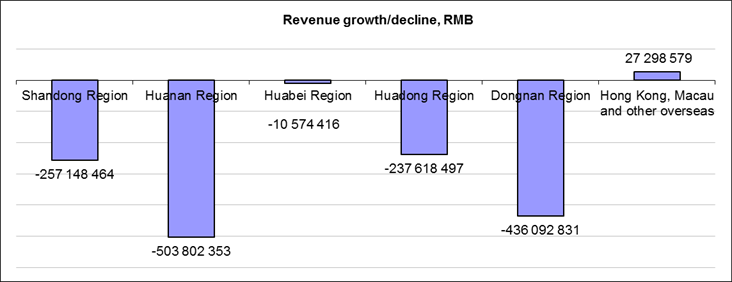
The revenue there fell by 15.59% and the loss amounted to 25.78 mln yuan. This region provides 8.54% of the company’s sales.
Tsingtao Brewery incurred substantial losses in Huanan Region, where the revenue came 11.45% down, while the net profit decreased by 75.54%. This region accounts for 14.1% of businesses’ profit in South China. Here the company is quite poorly represented as compared to competitors.
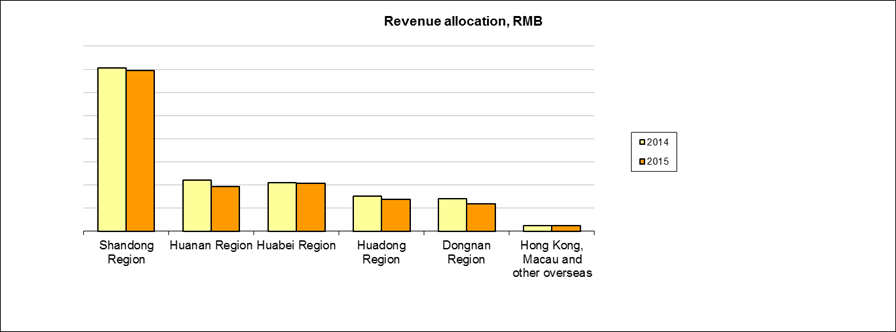
Though in Shandong Region the revenue decline amounted to only 1.82%, this influenced Tsingtao performance substantially as Shandong region and surrounding regions account for 50.22% of the net profit and 75.18% of the revenue.
Here Tsingtao positions are among the leading ones as in Shandong province 60% of the production accrue to the company. The company’s products have equally wide representation in Shaanxi (78% of the local beer output) and Shagnhai (70%).
| 2014 | 2015 | |||
| Revenue | Net profit | Revenue | Net profit | |
| Shandong Region | 14 136 469 427 | 1 478 118 811 | 13 879 320 963 | 1 211 966 258 |
| Huanan Region | 4 401 431 421 | 277 405 568 | 3 897 629 068 | 67 857 114 |
| Huabei Region | 4 185 880 314 | 494 143 474 | 4 175 305 898 | 433 010 603 |
| Huadong Region | 3 029 370 253 | -267 450 996 | 2 791 751 756 | -462 276 846 |
| Dongnan Region | 2 797 425 636 | 76 286 842 | 2 361 332 805 | -25 779 599 |
| Hong Kong, Macau and other overseas | 493 720 960 | 26 794 316 | 521 019 539 | 42 682 094 |
| Finance Company | 2 725 072 | 184 801 246 | 7 090 439 | 175 741 684 |
| Unallocated | 2 298 083 | -239 565 940 | 1 235 572 | 157 522 512 |
| Elimination | — | -11 001 254 | — | 11 319 694 |
| Total | 29 049 321 166 | 2 019 532 067 | 27 634 686 040 | 1 612 043 514 |
| Revenue growth, % | Net profit growth, % | |
| Shandong Region | -2% | -18% |
| Huanan Region | -11% | -76% |
| Huabei Region | 0% | -12% |
| Huadong Region | -8% | -73% |
| Dongnan Region | -16% | -134% |
| Hong Kong, Macau and other overseas | 6% | 59% |
| Finance Company | 160% | -5% |
| Unallocated | -46% | -166% |
| Elimination | — | -203% |
| Total | -5% | -20% |
Such dramatic profit decline of the company on all the country regions could not be compensated by а 5.53% sales growth in Hong Kong, Macau and overseas because their share in Tsingtao net profit is 1.89% only.